Case Studies of ManeaX '03
In April 2003 the committee Maneax '03 organized a trip to the USA and Mexico. The following companies provided a Case Study for that study tour. The reports of these casestudies can be read by clicking on the names of the companies. They give a good impression of the possibilities, but companies are of course always welcome to come with other proposals.
Back to 'introduction case studies'
Case from NAM
students: Hylke Akkerman and Ruud Vinke
contact: W.M. van Gestel
supervisor: Prof. Dr. J.Th.M. De Hosson
Introduction
This research has been performed at the Material Science group of Prof. Dr. De Hosson of the University of Groningen. The question for this case was the following: Why and how originate cracks near girth welds in gas pipelines made of 13% Cr supermartensitic stainless steel?
The following points were investigated:
- Where do cracks emerge? (Heat-affected zone (HAZ), inside tube, carbides, etc.)
- What are the phases and structures in the HAZ? (indentation, etching, x-ray diffraction stress measurements, SEM/TEM)
- How is the crack propagation? (inter/trans granular, structures, load test)
- What are the welding conditions and what is the affect of these conditions on the material?
- Does the material first start to corrode and than crack or vice versa, caused by stress in the material?
To find an answer to question 5, more samples of different ages is needed, so for example one tube just welded, another one year old, etc. This could not be supplied, so this question could not be answered. However, the general opinion is that this is almost a simultaneous effect.
Research
With the supplied x-ray photographs of a weld, some parts were selected where probably most of the cracks were present. Cross-sections were made of pieces containing cracks and samples were made (figure 1) for the optical microscope Scanning Electron Microscope (SEM), for etching and for the Tunnel Electron Microscope (TEM).
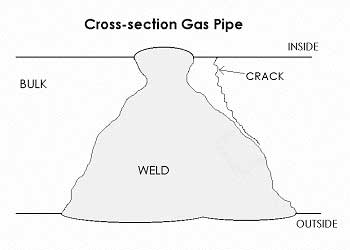
figure 1. Cross-section of a piece of pipeline containing cracks.
With etching different weld layers could be made visible. With the optical microscope also the weld/bulk interface (WB-interface) could be investigated. Grain structures in the bulk were also visible. Also different phases could be seen, differing in colour caused by etching.
On the etched sample a Vicker's hardness measurement was performed. This was done to map the hardness at the WB-interface. In general the following could be concluded about the hardness in this region: The hardness is the lowest in the weld, the bulk is a little bit harder and the hardest is as expected the WB-interface.
With the SEM also so-called mappings were made of the elements in these samples with the help of EDX. It was clear that a higher concentration of chromium was present in the weld. Next to this, a little could be said of concentration differences (caused for example by carbides) at grainboundaries and near the crack. It was made clear that all kinds of pollution can come from the crack when the sample is drying and this makes it more difficult to look at different concentrations near the crack.
For the nano-indenter a new sample was made. This was used to map the differences in hardness near the end of the crack at a very local scale. There were some differences in hardness present: bigger hardness just in front of the crack. These differences were probably caused by the fact that the crack is propagating between the grains. These grainboundaries have a bigger hardness. This was confirmed by OIM measurements, that made very clear this is an intergranular cracking process.
With X-ray Diffraction measurements high stress differences could be seen around the weld. These differences could be caused by the different phases present in the material, but this is not certain.
Load tests were performed and it was made clear that uncracked samples don't start to crack at the same location just next to the weld. This is a good indication that the cracking process is not caused by external influences. A load test on a cracked sample was also done. The crack transition could be investigated with the help of the SEM. Clearly the crack already present was intergranular and also the grains were clearly visible. These were teared apart in the region that was not yet cracked and that was crack due to the load test (figure 2).
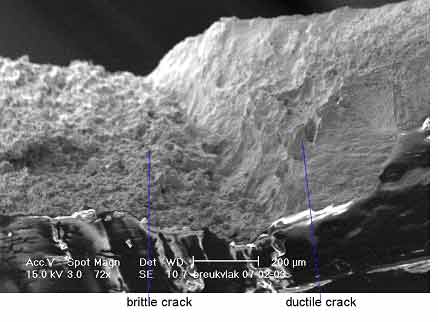
Figure 2. Crack transition from brittle to ductile.
With the TEM structures were made visible that could be carbides, but this is not a certainty.
Conclusively not an unambiguous cause could be determined for the cracking of 13% Cr supermartensitic stainless steel near girth welds. However, this research contributed to the knowledge in this field and furthermore it gives a number of probable causes for the cracking.
[top]
Case from Astron
student: Martijn Bodewes
contact: Dr. M. van Veelen
Astron is working on the LOFAR project. The LOFAR will be a major new multi-element, interferometric, imaging telescope designed for the 10-240 MHz frequency range. To build this new telescope all kinds of hardware is needed. Because of the size of the LOFAR project, it is important to know the characteristics of specific hardware elements.
Those elements (components) are for example FPGA�s (field programmable grid array�s). On such components certain techniques can be implemented (like a Fast Fourier Transformation). A particular implementation of a technique on component has a certain performance (speed, powerused, number of logic elements used etc etc). Researchers at Astron have tested lots of different basic techniques on basic components. The results of those tests, also called mappingresults are stored in a database. The amount of data generated is huge. The gain some grip on the data a comprehensive, easy to use interface was needed. Such an interface must be straight forward to use and the date has to be organized in a structured manor. The web interface is the first step in the direction of a combined knowledge system for techniques, components, implementations, test results and complete simulations of embedded systems.
To archive these goals a web interface was designed and created. The different components and techniques are displayed in a multilevel tree structure, very much like the tree structure used in the Windows Explorer file browser. Descending down into the tree one can click on different nodes. Each node, containing a component or technique will cause a datasheet and menu bar to appear on the screen. In the menu bar different actions can be chosen. A few of the possible actions are for example adding web links to a particular component. For example the website of the manufacturer of the component. An other feature is the storage of the test results of a techniques on a component
All those results can be used in an other application (which wasn�t part of this case) that can simulate the overall performance of combined components and techniques. The use of this knowledge can greatly reduce cost and improve performance of the system being developed.
The web interface to the database was made with PHP (www.php.net) and JavaScript. The database it self is a MySQL(www.mysql.com) database. The whole system is build to be run on an Linux web server. The clients can request the information with their local web browser at their own workstation via the intranet. There are a few drawbacks to such system. At first if many users are updating and inserting data in the database the state of the database presented to the user can be out of date. Due to the nature of web browsing there is no way to avoid the system of displaying out of date information. The second draw bask is the variety of web browser which all hold their own principles and implementations of HTML and especially JavaScript. This makes it difficult to make a system which is compatible with all browsers and is on the other hand very dynamic and easy to use.
[top]
Case from SKF
student: Johan Brondijk
contact: Dr. E. Vegter
supervisor: Prof. Dr. J.Th.M. De Hosson
Introduction
Most SKF-bearings are made of one type steel: SAE 52100 bearing steel, which contains typically 1.0 wt% C and 1.5 wt% Cr. Bearings are designed and produced to outlive the construction they are part of. The majority will satisfy this condition, but a small amount (<1%) shows failure much earlier than predicted. There are many possible failures, but one frequently occurring failure type is not well understood. In the sub-surface region, about 0.7 to 1.8 mm below the surface, so called white-etching areas (WEA) are observed. This are areas with other material properties and along this areas cracks start to grow, which will damage the bearing. The WEA are probably initiated by hard inclusions.
My task was to determine the hardness and microstructure of this WEA's. The sample I investigated came from a outer ring of an SKF-bearing, which was used in an industrial gearbox.
Methods and Techniques
The hardness has been measured with nanoindentation, the microstructure has been investigated using SEM and TEM.
At its most basic level, an nanoindenter employs a high-resolution actuator to force an indenter into a test surface, and an high-resolution sensor to continuously measure the resulting penetration. From this load-displacement data, the hardness and modulus of the sample can be derived. This technique has been developed for the purpose of probing the material properties of very small volumes of material. For this task it was also very useful, because the WEA's have a thickness of only a few micron.
Scanning electron microscopy (SEM) was used to investigate where the indentations where placed: in a WEA or in the matrix. SEM was also used to look at the sample at high magnification (>100.000 x).
Transmission electron microscopy (TEM) was used to investigate the microstructure of the WEA at very high magnification.
Results and Discussion
A row of nano indentations is shown in Fig. 1. After etching, it can be revealed using SEM whether an indentation was made in an WEA or in the matrix. This technique reveals that the hardness of the WEA's is 15% to 65% harder than the surrounding matrix.
With SEM and TEM the grain size is determined and also element concentration measurements have been done.
Conclusion
The formation of the WEA usually starts at an inclusion between 0.7 to 1.8 mm below the surface. Nanoindentation reveals that the hardness of these areas is 15% to 65% harder than the surrounding matrix. TEM and SEM measurements show that the WEA consist of elongated areas of very small grains, 30 to 45 nm of Ferrite. It is suggested that this is the reason for the higher hardness of the WEA, according the Hall-Petch equation, which tells us that the smaller the grain size, the higher the hardness.
Further investigations should concentrate on more precise measurements of element concentrations and dislocation densities.
[top]
Case from Schuitema
students: Arend Dijkstra and Hans Timans
contact: F. Jonker
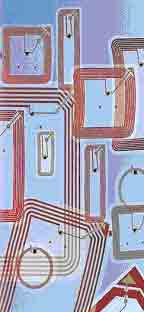 Schuitema, the main organization behind the C1000 supermarket chain in the Netherlands was interested in the development of Radio Frequency Identification (RFID), and in particular the use of this techology in their supermarkets. Therefore they took the opportunity to have us chart all recent and future development of RFID, mainly done by the Auto-ID center at MIT in Boston.
RFID is a technology that uses radio waves to communicate between tags and a reader, each tag holding a specific code for the product it is attached to. Tags consist of two parts: an antenna and a small integrated circuit, which is the heart of the tag. The reader emits a radio wave that triggers the tag, after which the tag is activated and starts to modify the radio wave it has just received using amplitude modulation. The modified radio signal now contains the electronic product code (EPC) that is stored inside the IC and will be transmitted back to the reader, that can use the info from the tag to query a database using the EPC. After this process the main computer knows what tag is located in what place, and using several readers and thousands of tags it's now possible to locate a very large number of objects.
In a supermarket the optimal scenario would be to tag every single product on the shelf by installing several readers inside the store. This way the inventory of the store can be monitored in real time, check-out time will be reduced significantly, easy theft prevention methods will be available, article prices can be adjusted in a nanosecond, and many many more features will become available.
To implement all this technology lots of changes have to be made to the supermarket supply chain network, as well as inside the supermarket itself. The cost and time period in which to complete all these modifications are points of great interest to Schuitema, and required some thought by us. Our job was to chart all the developments in the sector and carefully make a prediction on the applicability and the cost of adapting RFID technology in the supermarket chain.
RFID is a technology still in its infancy. Maybe applications in logistics will soon be available. More than ten years may pass before each item in our own supermarkets is tagged and all the promisses of RFID can be realised. This is due to the fact that the production and distribution of articles which can be bought in the supermarket is a complicated process, as well as to the fact that a lot of development needs to be done before tags in each article can be accurately read.
During this case study we had frequent contact by email with Tom Ahlqvist Scharfeld, which eventually resulted in a visit to the Auto-ID Center at MIT with the whole Maneax '03 group.
[top]
Case from Microsoft Netherlands
students: Casper Bodewitz and Niels Heinis
contact: P. van Groenewegen
supervisor: Ir. S. Achterop

This document is a report of our casestudy for Microsoft on behalf of the FMF excursion "ManeaX" to North and Central Amerika. It contains a per day overview of the first week, which we spent in Nijmegen, and a short descriptions of the weeks thereafter.
Day 1
This first day was scheduled to be used to get a theoretical background for the upcoming days. Ewoud Janse from Microsofts Intelligent Staffing, whom we already knew from an Xbox meeting at the university, presented to us the ins and outs of the .NET framework; how it works, what the pros and cons of the framework are and which products belong to the .NET framework.
It was a very clear presentation and also critical questions from us and the ROC teachers were answered very well and clear.
After a general introduction to the .NET framework, Ewoud Janse took a closer look at "Web Services", which is the buzzword within the business comunitee to finally integrate the internet in a business model very well. Web Services form an integral part of the .NET Framwork and de Microsoft Product Line of which Visual Studio is the central product.
Halfway this presentation we were introduced to attribute based programming. This technique uses keywords or tags in the program code that tell something about a certain piece of code. For example, the tag "[WebMethod"] indicates that the upcoming method is presented as a WebService. Instead of having to write all the accompanying code, the code is generated behind the scenes. The generated code can always be edited manually. This can all be done using only one IDE, Visual Studio .NET and no knowledge about the underlying protocols SOAP, UDDI, WSDL and XML is necessary to build simple web applications.
We had a very good lunch, which was the start of a week of very creative lunches at the ROC Nijmegen. There was a cook that liked to serve us very good lunches every day. The ROC Nijmegen is a very hospitable school, everything was managed very well which contributed to a productive week.
Besides Ewoud Janse there were two other people from Microsoft in Nijmegen this first week, Peter Groenewegen and Peter Criellaard. Peter Groenewegen provided us with a place to sleep in a very good hotel near the station. After the end of the first course day we went to the city centre to eat a pizza in one of the numerous restaurants in Nijmegen where Peter Groenewegen told us about his work experience and work at Microsoft's in Seattle.
Day 2
This day we started work on the main goal of this week, which was to meet Visual Studio.NET and explore the possibilities to integrate it into MBO education. This course/brainstorm session was meant to get an overview of the contents of the specialist course "Application Developer" and the application development part of the middle management course "ICT manager" as will be used in the new competence focussed qualification structure of MBO education. This overview then had to be compared with some Microsoft Cetrification exams to see if any streamlining good be accomplished.
During the course week we tried to accomplish this by a combination of:
Defining projects covering certain final terms meant to:
- Get teachers started with the software
- Accomplish the covering of studies with recognition of the MBO-ICT counter
- Compare covered skills of MCP-exams (MCAD, Microsoft Certified Application Developer) with the final terms of the course concerned.
- This gives an added value for the students and thus of the education institute (compare MCP W2000)
- This can provide exemptions for the normal and continuation courses
- Course material available via Microsoft Press, MOC and E-learning (coming soon)
- Offers better opportunities to external projects
- This course can be a motive to develop Dutch course material for the ROC's.
After Peter Criellaard had outlined the course week, we continued brainstorming about useful books and started with the exploration of Visual Studio.NET. From then everyone was programming and trying to develop some nice programs. Our general knowledge on software development was tested by means of answering quite a lot of small questions about .NET. Using the available books we could solve most problems and learned a lot about the .NET framework at the same time.
Day 3, 4
On the third and fourth day we continued supporting the teachers and the exploration of the books. Our task was to convert existing assignments to VS.NET solutions. Also the teachers developed some useful projects and together with our assignments this is all being collected and put on a CD-ROM so that it can become available to the MBO counter. Our first program in the .NET environment was the pyramid of Galton, which visualizes a binomial distribution.
Day 5
We spent this last day finishing the projects we started during this week and also determined the continuation track. After the last lunch, we all got some sandwiches for the trip back to Groningen. We are especially thankful to the ROC for the very hospitable week at their school in Nijmegen.
Next 3 weeks
With an evaluation DVD containing Visual Studio.NET as tools and some help from the books we got for further study and personal interest we started our continuation track. We have chosen a set of projects, varying from very simple to quite extensive, and implemented them in Visual Basic.NET and/or C#.NET.
An overview of the .NET framework can be found on the pages of de MSDN network.
[top]
Case from FMW
students: Nanne Huiges and Niels Maneschijn
contact: Dr. R.M.W.Hofstra
supervisor: Drs. J.H. Jongejan
Introduction
Together with hospitals in, amongst others, Genova and Paris, the AZG performs research in the field of Hirschsprung's Disease. This is a transmissible nerve disease which results in a malfunction of the intestines. Both patients and their families will be investigated. All data thus acquired will be gathered in Groningen for further statistical analysis.
At this moment all data is written down or stored in a spreadsheet. This hinders getting an overall view of the gathered data, and renders automated analysis almost unusable. Furthermore, entering data is complicated and prone to errors.
Goal
The goal of this case study is to build a database in which the participating hospitals can store their data and which can then be used to send the data to Groningen for analysis. This analysis will be aimed especially at whole families.
Microsoft Access was chosen as database management platform. This way, the hospitals will not need to buy additional hard- and software. Also, the database will need to be user friendly, and should only be changeable in Groningen, so the different databases will be able to be merged again.
The data
The patients are ordered by families. Because more copies of the database are being used, one cannot guarantee the uniqueness of a personal ID-number. Therefore a person is being referenced to by his number within his family, his family-ID and a code representing his geographical location. For each family the location is being stored, the kind of Hirschsprung's disease and the kind of inheritance (dominant or recessive). For each person a range of clinical and DNA data is stored, as well as gender, children and the type and activity of the disease.
For entering the data in a consequent way, this data can be selected from lookup tables, which have been compiled in Groningen.
The family relations are stored by entering the children for each person. Using this data, the whole family tree can be reconstructed.
The database
Because the database will be used by different people, spread over different countries, the database needs to be foolproof. It should be impossible to enter wrong or inconsistent data. Some fields are obligatory, and some combinations of fields are impossible and thus forbidden. Furthermore, families need to be consistent. No one should be entered as his own son or grandfather, and enough family members should be entered to make the family a whole. Checks are built in to deal with these matters.
For maintenance reasons the database should be protected against modifications.
Status
The choice for Access was not always the easiest. Some things turned out to be harder than expected. Fortunately, there were no real showstoppers.
The database is now being tested on usability and functionality. When this turns out successfully, the database will be split up and distributed over all participating hospitals.
[top]
Case from BME
student: Joost Massolt
contact: Prof. Dr. H. Duifhuis
supervisor: Prof. Dr. H. Duifhuis
Because of a treaty signed in Bologna the complete educational system at the University of Groningen had to change. From a 1+4 program, "propedeuse" and "doctoraal" to The 3+2 Bachelor Master system. The Biomedical Engineering (BME) program in Groningen, which begins at the third year of a physics student, also has to change.
Because of this oncoming change in program and curriculum, the staff of BME in Groningen wanted to know how the BME-programs in the USA were organised. My task was to go to the websites of several universities and to a good look around, and make a report about this. Because of the complexity of some sites and the various programs within the universities, a report would become very unclear. So instead of a report, I decided to built a website with all the information on it. The website is found at www.fmf.nl/~joost/case (Dutch).
I've visited various universities. From the prestigious and in our country well known universities like Harvard, Berkeley, Yale, Stanford, MIT and Princeton to the not so familiar but well-rated universities like Duke, San Fransisco, Purdue, Johns Hopkins, Boston, Louisiana and Miami. The type of education varies: from only a bachelor, only a master to a bachelor/master with a major and an minor, only a minor, only a Ph.D. etc etc. The BME-depths als vary. But at almost every university, the depths in Groningen (Biomaterials, Instrumentation and Medical Imaging) are also present. The BME-staff was also interested in then number of students at every university. This isn't always found at a BME-website, so i've mailed a lot of study-coordinators. The result of every mailing is also found at the site.
Finaly, a quote from the Boston University website:
Why BME?
BME is booming. Outgrowths of the human genome project will lead to newer and better diagnostics therapies, including gene therapy; specific engineering studies of nervous and cardiopulmonary systems are revolutionizing neural and tissue engineering; and medical imaging at minute and organ-level scales is providing virtually harmless diagnostic tools. And as these technologies develop, they change our world.
They change medicine, law, science, and industry. The industrial revolution changed forever the way the world worked; the recent networked information biotechnological revolution has changed the way the world communicates, and this revolution promises to change the way the world lives. Unpredictable, fortuitous results in the field of biomedical engineering in the past few years, some discovered by researchers at Boston University, have already become part of our everyday lives--and these results, in pharmacology, imaging, and gene therapy, are an optimistic prediction of the future-- a life wholly free of devastating diseases may be achievable before the end of the next century, and biomedical engineers will guide us into this next incredible era.
[top]
Case from Guide
student: Georg Muntingh
contact: Feiko Jilderda
Introduction
The aim of the case was to chart all publications (and patents) of the research school GUIDE (Groningen University Institute for Drug Exploration). This was done using a database on the internet (Web of Science), several local databases and manually submitments of the researchers themselves. All references were combined in a single Refmanager-file, from which (together with other information) the Annual Report 2002 was created.
About GUIDE
The best way to give a short introduction to GUIDE is probably by quoting itself: �The mission of GUIDE is twofold. Firstly, GUIDE promotes innovative drug research. This is done by combining an in-depth understanding of the pathophysiology of disease with the development of new medicines. Secondly, GUIDE offers a full-fledged educational programme for both graduate students and M.D./Ph.D. students interested in a research career in academia or (pharmaceutical) industry.�
Charting the publications
The proces of charting the publications is summarized in the picture below.
As follows from the picture three (types of) sources for references to publications were used, namely Web of Science, several local databases and manually submitments.
- Web of Science. Web of Science is a database available via the internet. By entering the name of the author (sometimes more information was needed) Web of Science retreived references to (for example) articles written by that author. (The used method was actually to first write a few long queries with about 50 author names (and other information) and submit these at once to Web of Science.) The result could directly be imported into Refmanager.
- Local databases. Several databases (for example Biological Abstracts, Embase and Medline) were locally available. For a fast conversion from these local databases to Refmanager I wrote some filters. These filters were applied to the (manually selected) relevant references resulting into a format which were imported into Refmanager.
- Manually submitments. In addition to these sources all researchers from GUIDE sent the remaining references and patents in their own favourite format (mainly Word) or as a Refmanager file. The Refmanager files could be merged easily with the existing databases. The other formats were added manually to the database.
After this several corrections had to be made upon the database.
- There were a lot of references refering to the same articles.
- Further more Web of Science seemed to relax the restrictions upon using the OR-operator, so a lot of references weren�t supposed to be there.
- A lot of names of researchers were not written in the right format so this had to be adjusted.
- The bookchapters found in Web of Science were written as being articles.
- To give every researcher a rating the journals corresponding to a rating had to be seperated from the magazin articles that don�t.
Finally the Refmanager file was handed over to GUIDE to generate (together with other information) the Annual Report 2002.
[top]
Case from Testprint BV
student: Astrid Tuin
contact: P. Massolt
supervisor: Prof. Dr, Ir. L.P.B.M. Janssen
To calender or to stirr?
In this case an attempt is made to develop mathematical models for two different systems used for the testing of printing inks. From these models the kind of flow and the stresses the ink undergoes should become clear. The first system consists of two rotating calenders, the second system is a marine type propeller stirrer placed in a cylindrical vessel.
The approach is the same for both systems: the Navier-Stokes equations reduce to a second order differential equation, which is solved (with the help of appropriate boundary consitions) for the velocity of the ink in the middle of the nip (the smallest space between the two calenders) in the case of the calendering system and for the inkvelocity between the propeller and the bottom of the vessel in the case of the stirring system. The volumetric flow can be calculated and with this value and the equation for the velocity the pressure gradient is computed. By integration of this pressure gradient with the boundary condition that the pressure is 0 at infinity the pressure is determined. Further, the shear stresses that act upon the ink at the walls of the nip (calenders) and at the stirrer and bottom of the vessel (stirring system) can be calculated. The elongational stress upon the ink in the middle of the nip (calenders) and between the propeller and the bottom of the vessel (stirring system) are also determined.
This whole process was first done in both systems for a Newtoninan fluid. For a Newtonian fluid the shear stress is proportional to the shear rate and the constant of proportion is the viscosity ( ) of the ink. Then the calculations are repeated for power-law fluids, because printing inks usually are modeled as power-law fluids. In power-law fluids the shear stress is proportional to the shear rate to the power n (about 0.5 for inks), the constant of proportion is the consistency K (for inks between 100 and 200).
With these equations four programs are written in Matlab: for each system one for a Newtonian and one for a power-law fluid. The output of these programs are graphs of the velocity of the ink, the pressure gradient, the pressure, the shear stresses and elongational stresses; all plotted against the position in the nip (calenders) or the posisition under the propeller (stirring system). In these models the geometry of the system and other parameters of the system and the ink can be changed easily. The effect of changes of the radius of the calenders or stirrer, the number of revolutions per second of the calenders or stirrer, the width of the nip (calenders), the viscosity of the ink (for a Newtonian fluid) and the consistency and power of the ink (for a power-law fluid) are predicted.
The following conclusions are drawn:
- The ink velocities are of the same order of magnitude in both systems and the flow is totally laminar for the calendering system and also predominantly laminar in the stirring system. In the latter there is a turbulent vortex flow at the tip of each propeller blade.
- The biggest difference between the systems is that the flow in the calenders is completely symmetrical, each revolution an ink particle undergoes the same stresses, whereas in the stirrer you cannot know how often and at what height between the stirrer and vesselbottom a particle passes (you only know the mean number of passages per second for all ink particles). This uncertainty is increased by the turbulent vortices at the tips of the propellerblades.
- The order of magnitude of the shear stresses is the same for both systems.
- The pressure gradient and the elongational stress in the calendering system are a factor of about 102 bigger than those in the stirring system (for the elongational stress this is based on a hand-waving argument).
A critical remark has to be made that though the model for the calendering system is a good representation of the real system, the model for the stirring system ("spreading with a knife") is a considerable simplification of the real system.
[top]
Case from Academic Hospital of Groningen
student: Wouter van Strien
contact: Dr. W. Vaalburg
supervisor: Dr. H. Hasper
What is PET?
Positron emission tomography (PET) is a technique for measuring the concentrations of positron-emitting radioisotopes within the tissue of living subjects. A wide range of compounds are used in PET. These positron-emitting radionuclides have short half-lives and high radiation energies. The main positron- emitting radionuclides used in PET include Carbon-11, Nitrogen-13, Oxygen-15, and Fluorine-18, with half-lives of 20 min, 10 min, 2 min, and 110 min respectively. These compounds are commonly known in PET as tracer compounds. These tracer compounds are administered by means of injection or inhalation, the purpose being simply to enter the compound into the bloodstream. It is the short half-lives of these tracers that allow large doses to be administered to the patient with low radiation exposure and enable studies to be repeatedly performed. The compounds are produced with a cyclotron in the basement of the hospital. The chemical form of these compounds is simple so before injecting these in the patient the radio chemist synthesizes the desired complex molecules.
The imaging in PET is all indirect. It relies on computerized reconstruction procedures to produce tomographic images. It is performed by means of detecting positron-emission by use of tomography. Two ways in which radionuclides decay that will reduce excess positive charge on the nucleus include the neutralization of a positive charge with the negative charge of an electron or the emission of a positron from the nucleus. The positron will then combine with an electron from the surroundings and annihilate. Upon annihilation both the positron and the electron are then converted to electromagnetic radiation. This electromagnetic radiation is in the form of two high-energy photons which are emitted 180 degrees away from each other. It is this annihilation radiation that can be detected externally and is used to measure both the quantity and the location of the positron emitter. Simultaneous detection of two of these photons by detectors on opposite sides of an object places the site of the annihilation on or about a line connecting the centers of the two detectors. At this point mapping the distribution of annihilations by computer is allowed. If the annihilation originates outside the volume between the two detectors, only one of the photons can be detected, and since the detection of a single photon does not satisfy the coincidence condition, the event is rejected. Simultaneous detection provides a precise field of view with uniform sensitivity. This occurs because wherever the disintegration takes place between the two detectors, the photons must in sum have traveled the full inter detector distance in order that the event be recorded.
PET-scan of patient with breast cancer. The arrow points out the tumor.
This technique is mainly used to measure deviations from normal metabolism, but as in the AZG also brain research is done with this technique.
My job
Part one
The cyclotron used for bombarding the targets to produce the desired compounds is controlled by a Programmable Logic Computer. It allows for the operator to define the presets of the cyclotron to control the amount of radio activity produced and gives readouts of the actual values of all kinds of parameters. The wish was to log all the presets and readouts with the most important reasons being to have information about the amount of produced radio activity and to have information about the working of the cyclotron so that faults could be investigated. In order to do this a program was written in Labview that constantly monitors serial data output by the PLC and puts it in a spreadsheet after processing it.
Part two
An existing Labview program controlling the synthesizing process was adapted so that more parameters and process values were automatically logged.
The part I played for a few weeks in this interesting group at the AZG PET center was only small, but still a lot of fun. The fact that I could work on two different parts of the entire process was really nice because to be able to program these programs a deeper understanding of the part process was necessary and so I learned a lot by talking with the staff from different disciplinary backgrounds. Thank you everybody! I had a great time!
[top]
|